Background
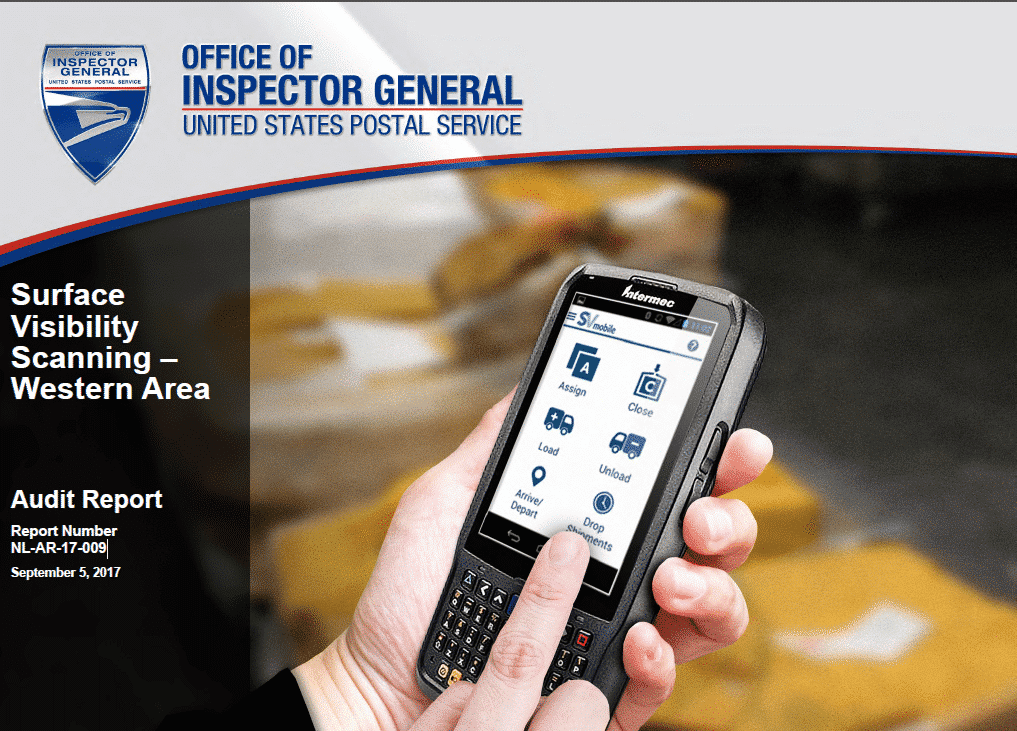
The U.S. Postal Services’ Surface Visibility Scanning (SV) network was intended to provide nationwide mail container visibility, real-time asset identification, and improved dock operations at over 430 sites. SV sites have Mail Transport Equipment Labelers (MTEL) to print barcoded placards that are scanned six different times using a wireless SVmobile scanning device. These scans record:
- Assignment of MTEL placards to mail containers;
- Closed mail containers for dispatch;
- Loaded mail containers on trailers;
- Departure of trailers from the dock;
- Arrival of trailers at the dock; and
- Unloaded mail containers from trailers.
Permanently affixed trailer barcodes are scanned twice to record:
- Departure of trailers from the dock;
- Arrival of trailers at the dock.
The Postal Service’s fiscal year (FY) 2017 national facility scan compliance goal is 91 percent. As of the week ending June 2, 2017, the reported percentage achieved is 92 percent.
We selected the Western Area for our audit because between FYs 2015 and 2016 it had the largest difference in facility scan compliance, ranging from 52 percent to 95 percent, a 43 percent difference. Subsequently, we judgmentally selected four Western Area processing and distribution centers (P&DC) for site visits to identify best practices that could be used to improve SV scan compliance. We selected the Albuquerque and Seattle P&DCs with the highest SV scan compliance rates of over 95 percent and the Portland and St. Paul P&DCs with the lowest scan compliance rates of about 60 percent within a particular quarter. The Western Area’s overall SV scan compliance rate increased from about 76 percent as of FY 2016, Q1, to about 92 percent as of FY 2017, Q2.
The objective of our audit was to identify opportunities to improve SV scan compliance at Postal Service P&DCs in the Western Area.
What the OIG Found
We identified three best practices at the two high-performing P&DCs in the Western Area that should provide opportunities for SV scan compliance improvement. In addition, we identified needed improvements in wireless connectivity that should improve scan compliance.
Western Area management attributed its improved overall SV scan compliance rate to conducting scan compliance meetings, using the reporting practices of another Postal Service area to monitor scan compliance, and providing scan compliance training for SV site coordinators. Based on our site observations, we agree that these practices contributed to their scan compliance rate.
During our visits to the Albuquerque and the Seattle P&DCs, the high-performing sites, we observed the use of expeditor and mail handler teams to improve scan consistency and the printing of new MTEL placards at the end of each tour to reduce failed scans. In addition, we observed the use of the posting of scan data printouts on the workroom floor that compared all Western Area P&DCs’ SV scan performance. This was done to highlight the importance of scanning compliance.
We also observed at the four P&DCs, about 15 percent of the mail containers without MTEL placards. This occurred because the P&DC staff did not always print and attach MTEL placards as needed and did not oversee highway contractors who discarded MTEL placards during their manual consolidation of mail for their routes.
Finally, we observed that the Portland and St. Paul P&DCs did not have adequate dock personnel to ensure all scanning was done during the tour one and tour three peak work periods. This occurred at the Portland P&DC because of authorized, but vacant, staff positions. Inadequate staffing also occurred at the St. Paul P&DC because management needed to improve their staffing coordination to ensure adequate coverage during peak work periods. During the audit, the St. Paul P&DC acting plant manager agreed with our observation and plans to reassign employees for adequate coverage.
Our analysis indicated that the missing MTEL placards and the inadequate dock staffing caused lower SV scan scores. Specifically, the average trailer load and unload SV scan scores at the four P&DCs were about 3 percent to 23 percent lower than the other four of the six required SV scan scores through FY 2017, Quarter 2.
We also found that the Albuquerque and Portland P&DC’s SV scanners experienced disruptions in connecting to the P&DC’s wireless network. This occurred because of structural building interference and interference from cellular phones, routers, and microwave ovens sharing the same frequency as the SV scanners and network. Additionally, the Portland and St. Paul P&DCs’ SV scanners could not connect because of interference from the employees’ Bluetooth® connection on their mobile phones.
Finally, we found that P&DC staff can perform multiple SV scans for all of the six SV scan events. Postal Service customers are only able to view the most recent scan. As a result, a later scan of the same event provides incorrect SV scan data to the customer.
Headquarters Enterprise Analytics was aware of the duplicate SV scan issue and conducted a system update in April 2017. The update did not work and management is working on another fix. We are not making a recommendation because management is actively working on a solution. We will continue to follow this issue for any future audit work.
What the OIG Recommended
We recommended management:
- Ensure area implementation of the three best practices we identified.
- Require P&DC managers to develop procedures to ensure MTEL placards are printed and attached to all mail containers and highway contractors do not discard MTEL placards.
- Adjust staffing and scheduling to ensure adequate staffing during peak SV scanning.
- Identify and resolve SV scanning connectivity issues.
